Descreening - removing printing screens
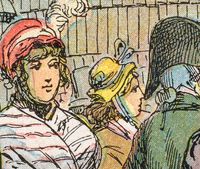
The representation of colored images has been a major issue in letterpress printing since the beginning. In the nineteenth century, people were looking for methods that could be integrated into the printing process, which was already very advanced at the time. The big problem was the representation of halftones. The first halftone processes were developed. Of course, among the illustrations in the project there were quite a few with halftone images. For example, here is a highly enlarged section of one of the illustrations with a screening that is unconventional from today's point of view:
If you rasterize an already screened image for the second time, moiré structures will inevitably appear. This must not happen, of course. So before the second rasterization, the first raster must be removed from the image. I am working with Photoshop in version CS6 and for descreening one of the blur filters could be used. Mathematically, these filters are based on a convolution of the image information with a smoothing function - in the case of the Gaussian blur filter, with a Gaussian function. In the "Other Filters" > "Custom Filter" tool, you could even define a simple smoothing function yourself. However, the setting options are so limited that even with this, no descreening can be achieved (Photoschop is not a math program, after all). With the Photoshop on-board tools, suppressing the raster inevitably affects the image information as well. But image information that has been removed cannot be restored even with a sharpening tool! A "raster-away" smoothing function for the convolution routines in Photoshop could probably be constructed. However, the application of the corresponding tool would require quite a lot of settings and explanations. This is probably why the product managers have decided against it.
If one looks more closely at the mathematical structure of the problem (raster = periodic structure), one comes to the conclusion that less effort is required by selectively cutting out the disturbing raster structures in the frequency plane/spectrum, than by convolving with an adapted kernel, which must first be constructed. For filtering, the image must be transformed using a Fourier transform (see e.g. here). Unfortunately there is no tool for this in Photoshop either. So I started my Matlab to create a corresponding filter routine. This would have to be a stand-alone solution, because I don't know enough about the Photoshop interface to integrate an external program into it. On the other hand, - it couldn't be that I am the first person wanting to use Photoshop to descreen, or Fourier filter an image! I started searching and after a while I found what I was looking for on a Norwegian site. There I found a Photoshop action that can eliminate the raster via Fourier filtering: The "Pattern Suppressor Action" is well documented, also with an instructive video.
Essentially, the program works like this: According to Fourier's theorem, any periodic function (=the image) can be represented by a series of sine and cosine functions. (Remark: Our image obviously is not "periodic", it exists only once. But this discrepancy is not a major obstacle in practice. The action elegantly tricks it out). In a first step, the image information at hand is transformed into the frequency or spectral plane. (No information is lost in this step. It is only represented differently!) In the spectral plane, a point is assigned to each image frequency (in the image space a grid-like pattern). In the center of the coordinate system sits the "zero frequency", which in image space corresponds to the uniform basic background brightness of the image. A point in the frequency plane represents a grid pattern in image space; the further out in frequency space, the finer the grid pattern in image space, whereat the location in the frequency plane defines the angle at which the grid lines lie in the image, with the direction defined by the perpendicular to the grid lines.
The blotchs forming the printing screen in above image are square shaped. So one can imagine the image of the basic printing screen as two superimposed crossed grid patterns, each with its distinct color. Thus, in the spectral plane, the image of a pattern formed by two crossed grid lines is represented by two points. If the grid is aligned parallel to the image margins, as in our example, the assigned spectrum points will lie on the frequency axes. Their distance to the center is a measure of the "wavelength" of the grid raster. Since the screen points in reality have sharp edges, "overtones" appear in their spectra, i.e. chains of additional points lying further out. But where is the information that corresponds to the actual image?
The pure image information without (freed from the) raster locates around the zero frequency. But how far around the zero frequency do we still find relevant image information in the spectral plane?
>>> Attention - at this point the video tutorial of the pattern suppression action is misleading, because the authors do not consider the Nyquist-Shannon sampling theorem.
In fact, in terms of this theorem, the print screen samples the image information. The print screen acts as a sampling function! According to the sampling theorem, the screened image should not contain frequencies higher than half the screen frequency! In the spectral plane, therefore, all relevant image information must lie in a circle centered at zero, and with a radius equal to half the distance of the closest raster peak to zero. Now how do we translate this theoretical fact into the pattern suppression tool?
So, after point 1 of the action is started, in the background the image is Fourier transformed, and after a small wait, the masked image spectrum appears in the window. In our example like this:
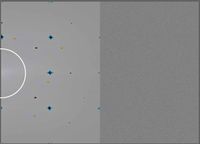
Shown is the actual plane with the spectrum, with an unstructured, homogeneous, semi-transparent gray mask plane above it.
Side note: In the above image, only the left side with the dots is relevant. This represents the right half-plane of the image spectrum. The other, left half-plane of the image spectrum for mathematical reasons consists of the mirror image (strictly speaking the conjugate complex mirror image) of the right one and was omitted in the Color parts of the Action. However, in the Grayscale part of the Action the whole spectral plane is shown - don't know why.
According to the instruction video, we should now brush those areas in the mask layer that will release the frequency information when back transforming into image space in the next step of the action. However, instead of painting around in the mask with an undefined brush, as suggested in the instructions, we first adjust the brush size according to the criteria given by the sampling theorem: We set the radius of the brush so that it corresponds at most to half the distance of the center to the nearest prominent (here blue) spot (cf. image above, white circle). It is important that we center the so adjusted brush circle to within one pixel of the zero point (to aim, enlarge the image to 100%), and only now click once - that's it. If the circle center center is not exactly at zero point, we will introduce artifacts into the reconstructed image. This is what mathematics tells us: The symmetry must be preserved! In this way we now have cut a round hole out of the mask, and in it we see in white the information that will be used in the next step to reconstruct the filtered image. Now we call Action point 2 (Apply Suppression) and after that point 3.
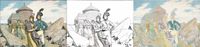
If then still parts of the screen are visible then because we have chosen the circle radius a bit too large. This is no drama. We simply start again with a smaller radius. If we did everything right, we get a result that from a mathematical point of view can not be better. Enlarged, above image section now looks like this:

We see that the screen has been removed from the colored areas without blurring the image information. There is no danger of moiré patterns appearing later in the print anymore. And as I said, mathematics assures us that it can't be done any better. In the original image there was no more information.
So much for the "healthy" workflow for image descreening. The presented historical example, however, exhibits an interesting feature, which I would like to point out here.
The picture originates from a picture book published in 1896 about the life of queen Luise of Prussia (1776-1810), who was still revered at the time -- Die Königin Luise in 50 Bildern für Jung und Alt (Queen Luise in 50 pictures for young and old). It was a mass-produced book printed in large numbers using the latest printing techniques. Let's take a closer look at the screened picture above. The original artwork was probably a colored engraving. The colors were not separated from the original, because the black lines would have had to appear on the color separations. The actual artwork probably consisted of the uncolored original engraving with the black lines, plus separate sheets bearing the colors red, blue and yellow. Only the color sheets were screened during plate making, the line stitch sheet was not. Accordingly, one can see a red, blue and a yellow screen. Apparently, subtractive color mixing was not yet an issue. The black printing plate that carried the line image obviously was not screened. For our work, this means that the black and white line art is not subject to the limitation of the Nyquist-Shannon sampling theorem quoted above! Its spectrum is therefore larger than that of the screened color areas.
So it is appropriate to treat the black and white image and the color image separately. Therefore we extracted the black lines from the image, removed them, and descreened only the pure color image according to the above steps. Finally, the line image was reunited with the descreened color image. This is how the final descreened image was created.
Remarks:
- The black lines in the descreened detail image exhibit visible "steps". These are not an artifact of the descreening process. The "stairs" were caused by the thresholding that had to be done in the course of line extraction. It allowed the color screen to "nibble" on the lines.
- The relation between an image and its spectrum can be understood in a purely formal sense (linear algebra) as here above. In an independent way, an image can be considered as a light distribution modified by an optical system. Then the mentioned relation results as a physical phenomenon from diffraction of light waves (Fraunhofer approximation) and was extensively investigated for possible applications in the late 1960s. Here two standard works about it:
-- P.M. Duffieux, L'intégrale de Fourier et ses applications à l'optique (2nd ed), Masson, Paris 1970.
-- J. W. Goodman, Introduction to Fourier Optics, McGraw-Hill, San Francisco 1968 - If one images a screened original with a digital camera, or if one scans a screened original, Moiré patterns appear exactly when the frequency of the imaged on the camera sensor is higher than half the pixel frequency of the sensor in the camera, or scanner. This moiré effect is called aliasing. The remedy for camera imaging is to enlarge the image, divide it into partial images, and then stitch them together. When scanning, select a higher scan resolution.